
Welcome to my investment portfolio, where I’ve curated a selection of innovative and well established companies poised for exponential growth. With a focus on disruptive technologies, emerging trends, and visionary leadership, these stocks represent my conviction in the potential for significant returns.
Long Term Investments
| Companies | Average Cost | Cost % of Portfolio |
| Microsoft | $290.95 | 5.6% |
| Meta Platforms | $186.80 | 5.6% |
| Alphabet (C) | $89.04 | 3.1% |
| Alphabet (A) | $153.25 | 2% |
| Amazon | $157.69 | 5.1% |
| Hershey | $175.06 | 6.4% |
| PepsiCo | $142.99 | 6.4% |
| Estee Lauder | $76.06 | 4.2% |
| Novo Nordisk | $69.47 | 4.9% |
| Nike | $63.87 | 4.9% |
| United Healthcare | $296.19 | 5.2% |
| Elevance Health | $308.53 | 5.1% |
| ServiceNow | $99.75 | 5.1% |
| Bitcoin | $76,613.67 | 4.7% |
| Kaspi | $13.69 | 1.2% |
| Cash | 26.4% |
Last Updated: Sep 25th, 2026
Short Term Trades
| Companies | Average Cost | Cost % of Portfolio |
| BMNR | $27.63 | 4.9% |
Last Updated: Sep 25th, 2026
Portfolio Updates
August Updates:
- Week Ending Aug 7th: Sold some Meta to bring the position down to fully allocated as the price went up.
- Week Ending Aug 14th: No Changes.
- Week Ending Aug 21st: Bought a little bit of Meta. Sold rest of the FactSet for 25% profit. Sold all Celsius for 2% profit. Celsius growth has slowed down, will buy again if price goes down. Keeping higher cash position for a potential 10% market draw down soon.
- Week Ending Aug 28th: Sold all Salesforce for 13% profit, stock went up 60% in 2 months, will buy again when price goes down. Sold little bit of Meta to bring the position down to fully allocated as the price went up. Moved Bitcoin from short term trade to long term position, planning to hold it for a while.
September Updates:
- Week Ending Sep 4th: No changes.
- Week Ending Sep 11th: No changes. Waiting for a market correction and a good opportunity to buy undervalued companies.
- Week Ending Sep 18th: No changes.
- Week Ending Sep 25th: Bought the first tranche of Kaspi for long term investment. It was in my watchlist for some time. It’s a good payment and financial services company from Kazakhstan with a decent growth and high dividend yield.
Yearly Performance
Annual returns over the years compared against the market.
| Year | My Portfolio | S&P 500 |
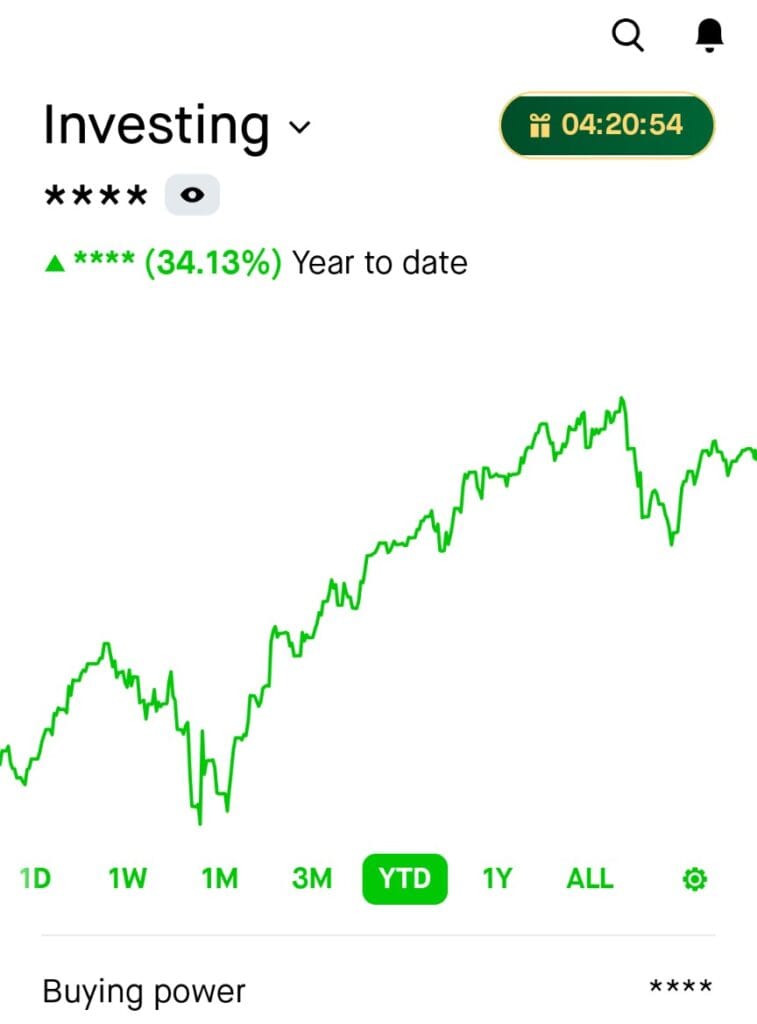
| 2025 | 34.13% | 16.65% |
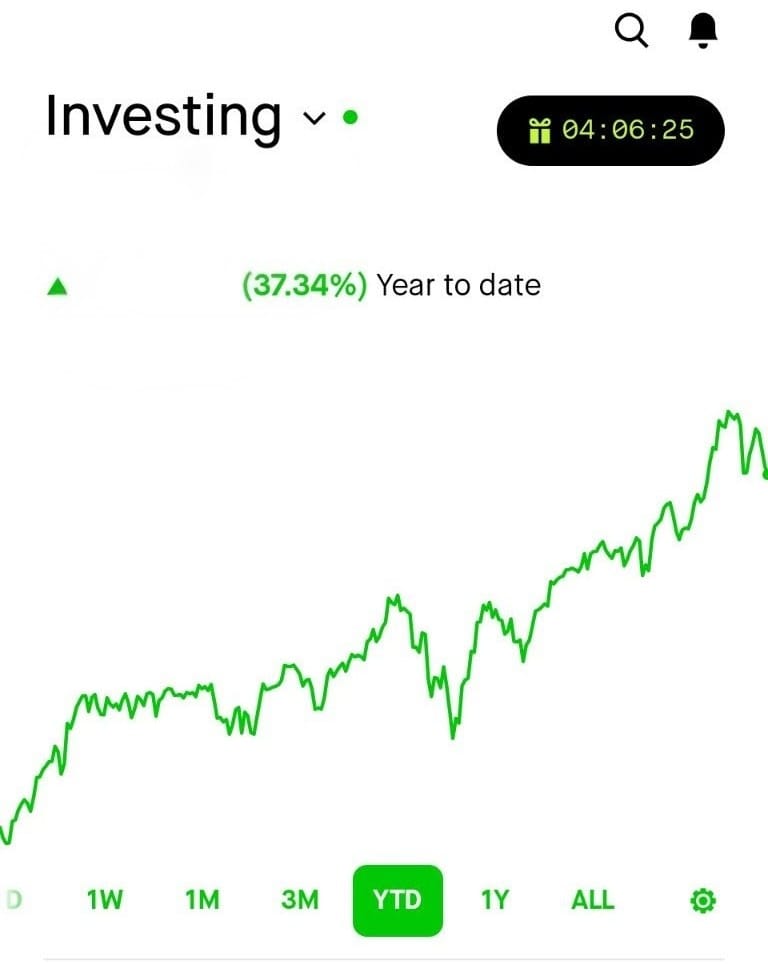
| 2024 | 37.34% | 24.13% |
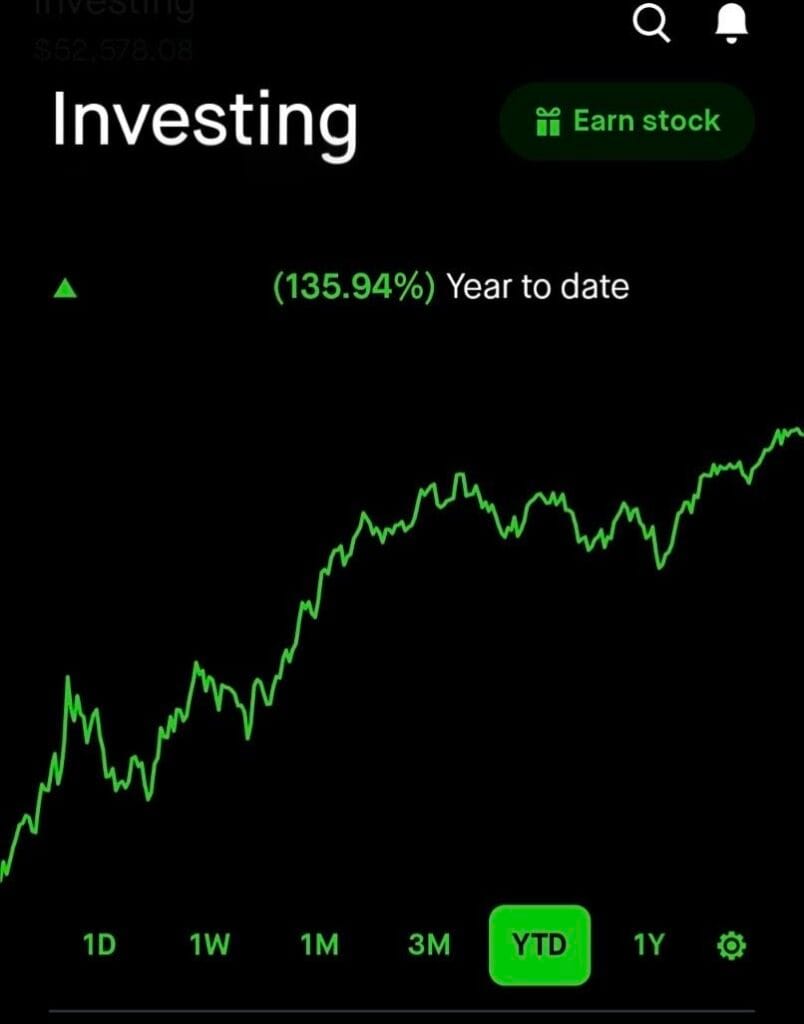
| 2023 | 135.94% | 26.19% |
| 2022 | -49.07% | -18.17% |
| 2021 | 11.59% | 28.75% |
| 2020 | 7.94% | 18.37% |
| 2019 | -91.75% | 31.22% |
| 2018 | -48.78% | -4.56% |
| 2017 | -10.50% | 21.70% |
Follow the stocks I am watching on my Watchlist page.
Follow my Home Run Investments page for my best performing sold stocks.